
TVL vs Revenue vs Active Users: What Matters More?
A Comprehensive Analysis of DeFi Protocol Performance Metrics

In the rapidly evolving decentralized finance (DeFi) ecosystem, three fundamental metrics dominate discussions among investors, developers, and analysts: Total Value Locked (TVL), Revenue, and Active Users. While each metric provides valuable insights, their relative importance in evaluating protocol success remains hotly debated. This comprehensive research examines 50 leading DeFi protocols using real-time data and normalized scoring methodologies to determine which metrics truly matter most for sustainable protocol success.
Author : Sangamesh Badachi
Comprehensive dashboard presenting the current state of DeFi protocols with key performance metrics, top performers, and market insights for 2025.
Executive Summary
Our analysis reveals that no single metric provides a complete picture of DeFi protocol health. Instead, the optimal evaluation framework depends on investment goals and time horizons. Through normalized scoring across four different weighting methodologies, we found that protocols excel in dramatically different areas: some achieve massive capital efficiency (Hyperliquid with 254% revenue-to-TVL ratio), others dominate user engagement (Uniswap with 850,000 active users), while traditional giants maintain their positions through sheer scale (Lido with $28.5B TVL).
Mastersheet : defi_protocols_analysis.xlsx
The Current DeFi Landscape: By the Numbers
The decentralized finance sector has matured significantly since its explosive growth in 2020-2021. As of July 2025, our analysis of the top 50 protocols reveals:
· Total Value Locked: $103.3 billion across analyzed protocols
· Combined Annual Revenue: $3.77 billion
· Total Active Users: 4.29 million estimated active addresses
· Average Revenue Efficiency: 3.65% (revenue as percentage of TVL)
Market Concentration and Category Dominance
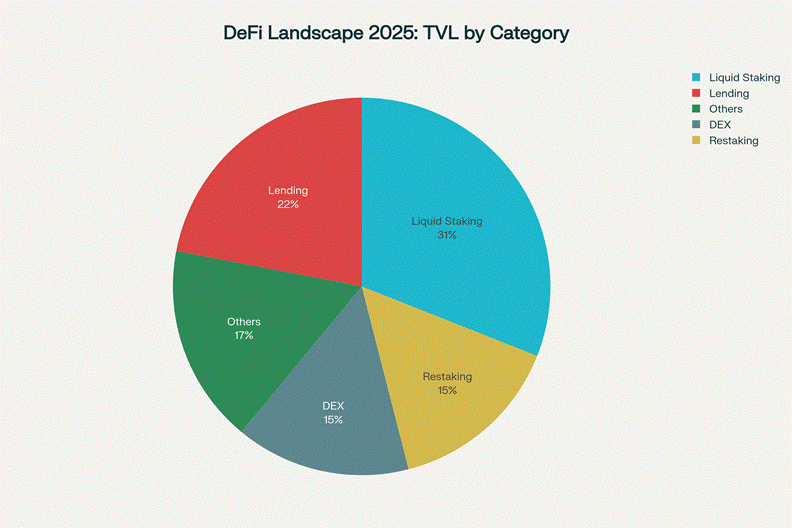
The DeFi ecosystem demonstrates significant concentration, with liquid staking protocols commanding 31% of total TVL, followed by lending platforms at 22%. This concentration reflects the maturation of certain DeFi primitives and the institutional adoption of liquid staking as a core DeFi building block.
Category Breakdown by TVL Share:
· Liquid Staking: 31% (Led by Lido's $28.5B)
· Lending: 22% (Aave, Compound, and others)
· Decentralized Exchanges: 15% (Uniswap, Curve, PancakeSwap)
· Restaking: 15% (EigenLayer leading the category)
· Other Categories: 17% (Perpetuals, Yield Farming, CDPs)
Methodology: Four-Dimensional Protocol Analysis
To address the complexity of DeFi protocol evaluation, we developed a comprehensive scoring framework using normalized metrics across four different weighting scenarios:
1. Equal Weight Methodology (33.3% each metric)
This balanced approach treats TVL, revenue, and users as equally important indicators of protocol health.
2. TVL-Focused Methodology (50% TVL, 25% each other)
Emphasizes capital attraction as the primary success indicator, favoring protocols that can accumulate and retain large amounts of user funds.
3. Revenue-Focused Methodology (50% Revenue, 25% each other)
Prioritizes actual fee generation and sustainability, reflecting protocols' ability to monetize their services effectively.
4. User-Focused Methodology (50% Users, 25% each other)
Highlights user adoption and engagement as the primary growth driver for long-term success.
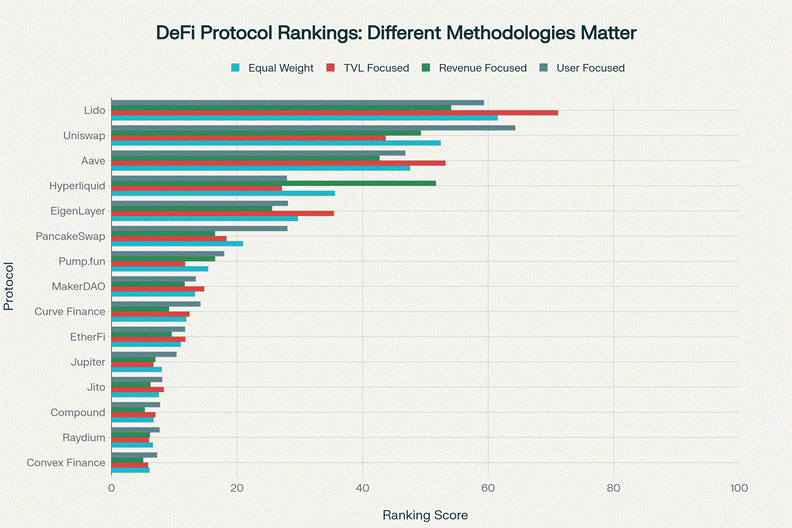
Comparative ranking chart showing how different weighting methodologies significantly impact DeFi protocol rankings, revealing the importance of metric selection in evaluation.
Top Protocol Rankings: Different Metrics, Different Winners
Our multi-dimensional analysis reveals how dramatically rankings shift based on evaluation criteria:
Equal Weight Rankings (Balanced Approach)
1. Lido (Score: 61.53) - Dominates through massive TVL and solid user base
2. Uniswap (Score: 52.43) - Strong across all metrics with exceptional user engagement
3. Aave (Score: 47.56) - Balanced performance with institutional adoption
4. Hyperliquid (Score: 35.58) - Revenue powerhouse despite smaller TVL
5. EigenLayer (Score: 29.69) - Emerging restaking giant
Revenue-Focused Rankings (Sustainability Focus)
When prioritizing revenue generation, the rankings shift dramatically:
1. Lido (Score: 54.10) - Maintains top position through scale
2. Hyperliquid (Score: 51.69) - Jumps to #2 with exceptional revenue efficiency
3. Uniswap (Score: 49.27) - Strong trading volume drives consistent fees
4. Aave (Score: 42.68) - Reliable lending revenue streams
5. EigenLayer (Score: 25.58) - Early-stage restaking revenues
User-Focused Rankings (Adoption Priority)
Emphasizing active user engagement creates another distinct hierarchy:
1. Uniswap (Score: 64.32) - Unmatched with 850,000 active users
2. Lido (Score: 59.34) - Strong staking community
3. Aave (Score: 46.80) - Broad multi-chain user base
4. EigenLayer (Score: 28.08) - Growing restaking adoption
5. PancakeSwap (Score: 28.01) - Strong BSC ecosystem presence
Protocol Efficiency Analysis: The Real Performance Indicators
Beyond absolute metrics, efficiency ratios reveal which protocols deliver optimal returns relative to their resources:
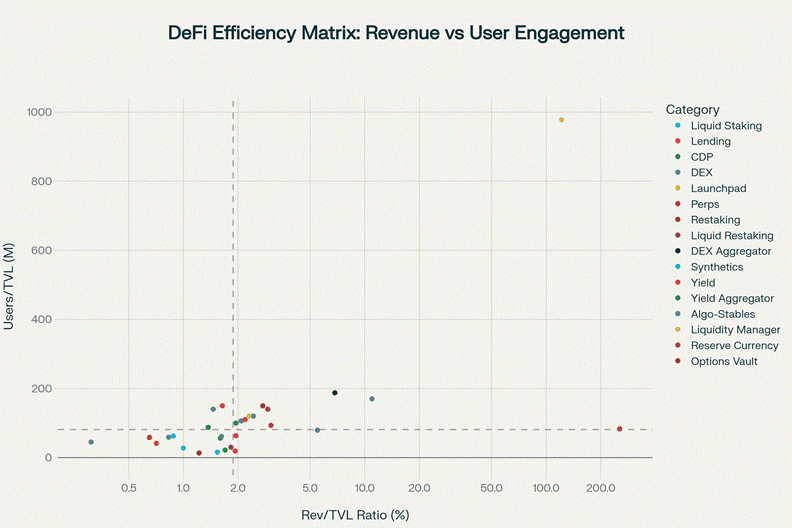
Efficiency matrix revealing which DeFi protocols achieve optimal balance between revenue generation and user engagement relative to their TVL.
Revenue Efficiency Champions
The most striking finding is the extreme variance in revenue efficiency across protocols:
1. Hyperliquid: 254.35% revenue-to-TVL ratio (Perpetuals trading)
2. Pump.fun: 121.57% ratio (Solana meme coin launchpad)
3. Uniswap: 10.96% ratio (Decentralized exchange)
4. Jupiter: 6.84% ratio (DEX aggregator)
5. Raydium: 5.48% ratio (Solana AMM)
These efficiency leaders demonstrate that protocol design and market positioning matter more than absolute scale for revenue generation. Hyperliquid's perpetual trading model generates over $1.38 billion annually from just $541 million TVL, while traditional giants like Lido generate $438 million from $28.5 billion TVL.
User Engagement Leaders
Protocols with the highest user-to-TVL ratios indicate superior user acquisition and retention:
1. Pump.fun: 978 users per $1M TVL
2. Jupiter: 188 users per $1M TVL
3. Uniswap: 170 users per $1M TVL
4. Abracadabra: 150 users per $1M TVL
5. PancakeSwap: 140 users per $1M TVL
The Three-Dimensional Protocol Landscape

Interactive bubble chart showing the three-dimensional relationship between TVL, revenue, and user base across top DeFi protocols, with categories color-coded for easy identification.
Our comprehensive bubble chart analysis reveals distinct protocol archetypes:
Scale Giants (High TVL, Moderate Efficiency)
· Lido: Dominates liquid staking with $28.5B TVL and 450,000 users
· Aave: Multi-chain lending leader with $20B TVL across 380,000 users
· EigenLayer: Restaking pioneer with $15B TVL and growing ecosystem
Efficiency Champions (High Revenue-to-TVL Ratios)
· Hyperliquid: Generates more revenue per dollar of TVL than any major protocol
· Pump.fun: Solana's meme coin factory with extraordinary efficiency metrics
· Jupiter: DEX aggregator with optimal capital utilization
User Magnets (High User Engagement)
· Uniswap: 850,000 active users across multiple chains
· PancakeSwap: 420,000 users dominating BSC ecosystem
· Pump.fun: 220,000 users despite modest TVL
Chain-Specific Insights: Multi-Chain Reality
The analysis reveals clear chain-specific advantages:
Ethereum's Institutional Dominance
Ethereum hosts the largest protocols by TVL, with institutional-grade infrastructure supporting massive capital deployment. Lido, Aave, and EigenLayer demonstrate Ethereum's role as DeFi's institutional backbone.
Solana's Efficiency Innovation
Solana protocols consistently demonstrate superior efficiency metrics. Jito, Pump.fun, Jupiter, and Raydium all achieve exceptional revenue-to-TVL or user-to-TVL ratios, reflecting Solana's low-cost, high-throughput advantages.
Layer 2 Growth Trajectory
Base, Arbitrum, and other Layer 2 solutions show promising growth patterns, with Base generating $285,417 in daily chain fees while supporting diverse DeFi ecosystems.
Category-Specific Performance Patterns
Liquid Staking: Scale and Stability
Liquid staking protocols like Lido and Jito demonstrate that TVL matters most in this category. Network effects and trust are paramount, making TVL the primary competitive advantage.
Decentralized Exchanges: User Volume is King
DEX protocols show that active users drive revenue more than TVL. Uniswap's 850,000 users generate $548M annually, while smaller DEXs with higher TVL often underperform].
Perpetual Trading: Efficiency Reigns Supreme
Perpetual protocols like Hyperliquid and GMX demonstrate that revenue efficiency trumps all other metrics. These platforms require minimal TVL to generate substantial revenue through trading fees.
Lending Protocols: Balanced Approach Required
Lending platforms require balanced optimization across all three metrics. Aave's multi-chain strategy achieves this balance with $20B TVL, $386M revenue, and 380,000 users.
Market Evolution and Future Implications
The Maturation of DeFi Metrics
Our analysis reveals the DeFi sector's evolution from speculative growth to sustainable business models. Early DeFi focused primarily on TVL growth through unsustainable yield farming incentives. Today's leading protocols demonstrate genuine value creation through:
· Real revenue generation from sustainable fee models
· User retention rather than just acquisition
· Capital efficiency optimization rather than maximum TVL accumulation
Emerging Trends Shaping Future Success
1. Revenue Model Innovation
Protocols like Hyperliquid and Pump.fun show that innovative revenue models can generate exceptional returns without massive TVL requirements.
2. Multi-Chain Strategy Imperative
Successful protocols increasingly deploy across multiple chains to maximize user reach and minimize concentration risk. Aave and Uniswap exemplify this trend.
3. User Experience as Competitive Advantage
Protocols prioritizing user experience (UX) consistently outperform in user acquisition and retention metrics, as demonstrated by Jupiter and Pump.fun's exceptional user-to-TVL ratios.
Investment and Development Implications
For Investors: Context-Dependent Evaluation
Our research demonstrates that optimal protocol evaluation depends on investment objectives:
· Conservative Investors: Focus on TVL-heavy protocols with proven track records (Lido, Aave)
· Growth Investors: Prioritize revenue-efficient protocols with scaling potential (Hyperliquid, Jupiter)
· Adoption-Focused: Target user-growth leaders in expanding ecosystems (Uniswap, PancakeSwap)
For Protocol Developers: Strategic Focus Areas
Different protocol categories require distinct optimization strategies:
· Infrastructure Protocols (Staking, Restaking): Maximize TVL through trust and security
· Trading Protocols (DEX, Perpetuals): Optimize for user experience and trading efficiency
· Financial Services (Lending, CDP): Balance TVL growth with sustainable revenue models
Risk Considerations and Limitations
Metric Manipulation and Gaming
TVL can be artificially inflated through incentive programs or double-counting assets across protocols. Revenue metrics may not reflect sustainability if driven by unsustainable yield farming rewards.
User Metric Accuracy
Active user counts represent estimates based on unique addresses, which may not accurately reflect genuine user engagement or may be inflated by bot activity.
Market Dependency
All metrics remain highly correlated with broader crypto market cycles. Bull markets inflate all metrics, while bear markets reveal genuine protocol fundamentals.
Conclusion: The Multi-Metric Imperative
Our comprehensive analysis of 50 leading DeFi protocols reveals that no single metric provides sufficient insight for protocol evaluation. Instead, optimal assessment requires understanding how TVL, revenue, and active users interact within specific protocol categories and market contexts.
Key Findings:
1. Context Matters Most: Protocol category and development stage determine which metrics are most relevant
2. Efficiency Trumps Scale: Revenue and user efficiency ratios often better predict long-term success than absolute TVL
3. Balance Beats Extremes: The most successful protocols achieve reasonable performance across all three metrics rather than excelling in just one
4. Innovation Drives Outliers: Novel protocol designs can achieve exceptional efficiency, as demonstrated by Hyperliquid and Pump.fun
The Future Framework: Rather than asking "which metric matters most," the optimal question becomes "which combination of metrics best serves my specific evaluation purpose?" This research provides the analytical framework and empirical data necessary to answer that question across different DeFi protocol categories and investment contexts.
As DeFi continues evolving toward institutional adoption and mainstream integration, protocol evaluation will increasingly require sophisticated multi-metric analysis. The frameworks and insights presented here provide essential tools for navigating this complex but promising financial frontier.
This analysis utilized real-time data from DefiLlama, The Block, Token Terminal, and other authoritative DeFi data sources as of July 2025. All metrics represent estimates based on publicly available on-chain data and may not reflect private or institutional usage not visible on public blockchains.
References:
1. https://tangem.com/en/blog/post/total-value-locked-tvl/
2. https://coinmarketcap.com/academy/article/90e3b655-cd0b-492d-8471-375e8499e6e0
3. https://defillama.com/protocol/pump
4. https://www.statista.com/statistics/1276161/defi-tvl-size-per-blockchain/
5. https://defillama.com/protocols/rwa
6. https://defillama.com/protocol/hyperliquid
7. https://coinlaw.io/decentralized-finance-market-statistics/
8. https://in.tradingview.com/markets/cryptocurrencies/prices-highest-total-value locked/
9. https://defillama.com/protocol/jito
10. https://www.coingecko.com/en/chains
11. https://defillama.com/chains
12. https://defillama.com/protocol/aave
13. https://forum.stacks.org/t/2025-roadmap-defi-road-to-1bn-defi-tvl/18032
14. https://www.theblock.co/data/decentralized-finance/total-value-locked-tvl
15. https://www.bulbapp.com/u/defillama-2025?sharedLink=b0252083-1ecb-4131-a955-205f8a1529ad
16. https://defillama.com
17. https://www.statista.com/statistics/1272181/defi-tvl-in-multiple-blockchains/